
"Pay for the effect, never for the risk." T-Data and exands fund the sensors, the edge AI and the engineering. You keep operating as usual — and pay a share of savings only after they are measured and verified.

Light equipment, fast deployment. No capital budget, no procurement cycle, no risk of stranded investment.

A two-week alternate-day test on your own meter proves the savings before any commitment. Fail the test and walk away — at no loss.

Once results are verified, fees are an agreed share of the measured savings — the fee is always smaller than the saving it comes from.

Monthly energy reports verified against the agreed baseline. Every baht of claimed savings is traceable to meter data.
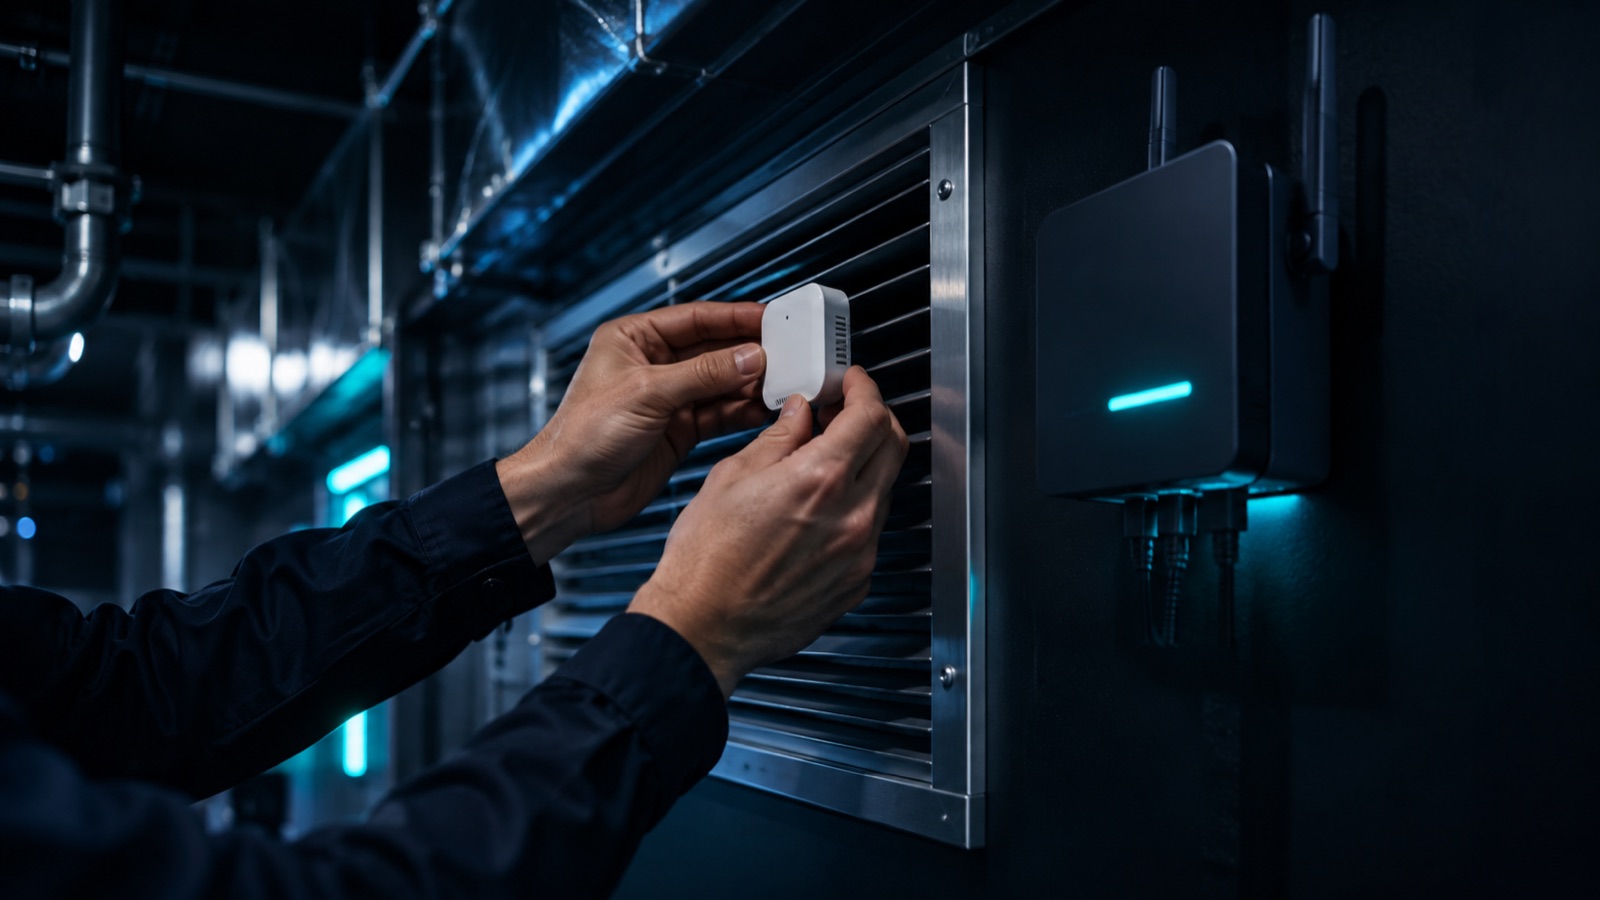
Site walk-through, historical bill review, and meter installation to establish a credible energy baseline.
Wireless passive sensors and the edge computing unit installed without interrupting operations.
The agent fits your site's data locally — equipment fingerprints, occupancy patterns, weather response — in about 10 days.
Alternate-day on/off testing quantifies the true saving rate on the main meter. You see the number before you commit.
AI-generated control strategies take over HVAC, ventilation and lighting — 7×24, with safety limits you approve.
Monthly verified savings report; fees settled as an agreed share of verified savings only.
Two independent methods, one principle: no trust required — only measurement.
The system runs on alternating days across two matching weeks, identical occupancy and weather exposure. The meter gap between "on" and "off" days is the saving — visible to anyone who can read a bill.
Using 2–3 years of your historical consumption plus occupancy/turnover data, we build a prediction table of "what you would have spent" at any temperature and occupancy. Savings = predicted baseline − actual consumption.
No. The AI operates inside comfort bounds you approve. Guests walk into pre-cooled rooms; chefs cook exactly as before. Adjustments are designed to be invisible.
That's what the A/B test is for — if the measured saving doesn't clear the agreed threshold, you owe nothing and can exit. After go-live, fees track verified results only.
The deployment stays ours during the revenue-share period, then can transfer to you. All site data belongs to you — it is learned locally and never resold or forwarded.
First verified numbers within 2–4 weeks; the first monthly savings report within a month of go-live. Most sites recover our full deployment cost within the first year of shared savings.
Book a site survey and we'll show you the A/B test plan for your building — free, in writing.
Request a Site Survey